
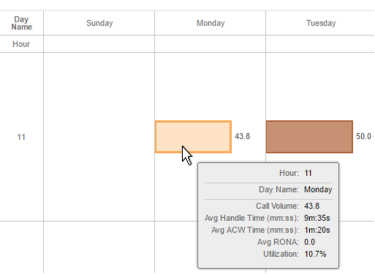
The Call Volume section of the Time of Day Analysis Dossier contains a grid with the percentage call volumes during the selected Hour range for all occurrences of a day of week within the selected Week range. Each cell in this grid displays the average call volume during a specific hour on all occurrences of a day of week in the form of a horizontal bar graph.
For instance, the value displayed in the “Call Volume” section for the 11th hour on Monday is the average of Call Volume during the 10 am -11 am interval on all Mondays between 6th and 27th February, 2017.
Note: The color-code parameters are based on the overall data and may be different from the above screen shot.
Each horizontal bar graph is color-coded based on the percentage of call volume.
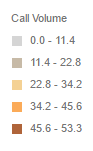
Note: The color-code parameters are based on the overall data and may be different from the above screen shot.
You can view the values of Call Volume and all other metrics by hovering over the bar graph.
Related concepts
© 2021 Digital.ai Inc. All rights reserved.